Session liquidity and macro tracker for ICT traders.
Flow Map is a TradingView indicator that paints session liquidity, key levels and macro windows directly onto your chart. Built for ICT traders who want context without 14 tabs open — every level you actually care about, plotted live, never more than a glance away.
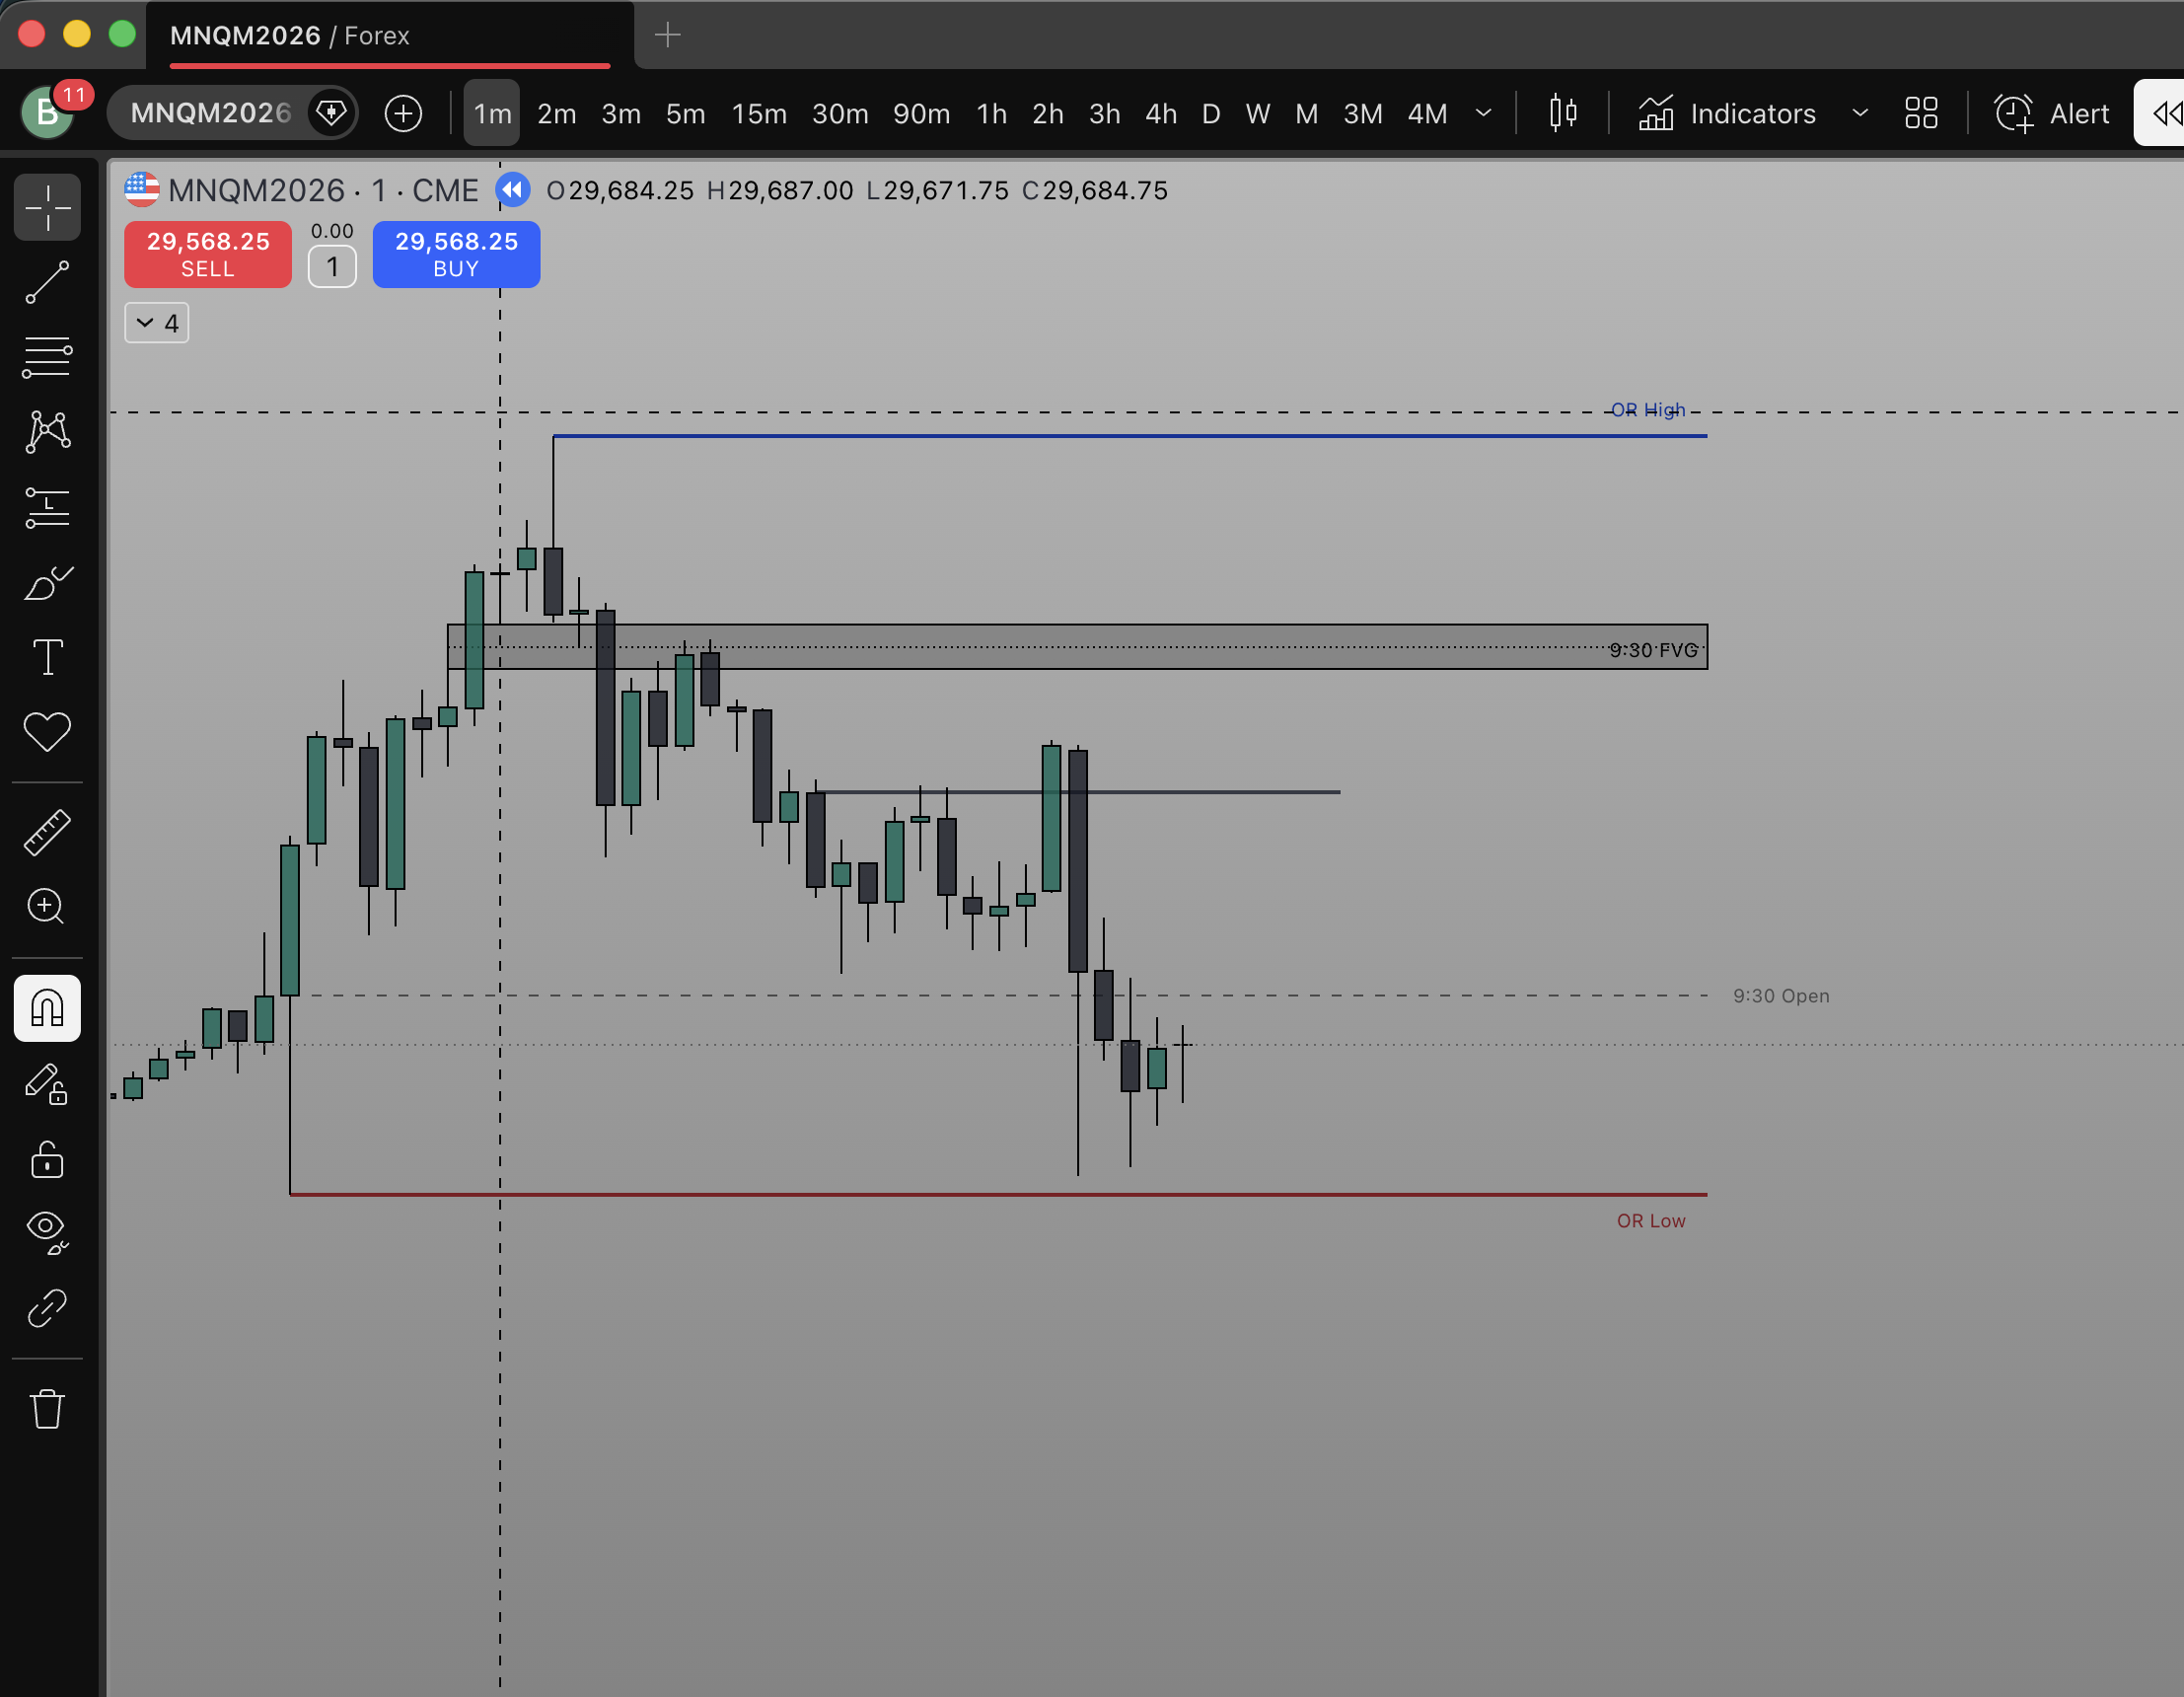
The levels ICT traders actually watch — sessions, key opens, previous-day and -week liquidity, FVGs and macro windows — all plotted live, never more than a glance away.
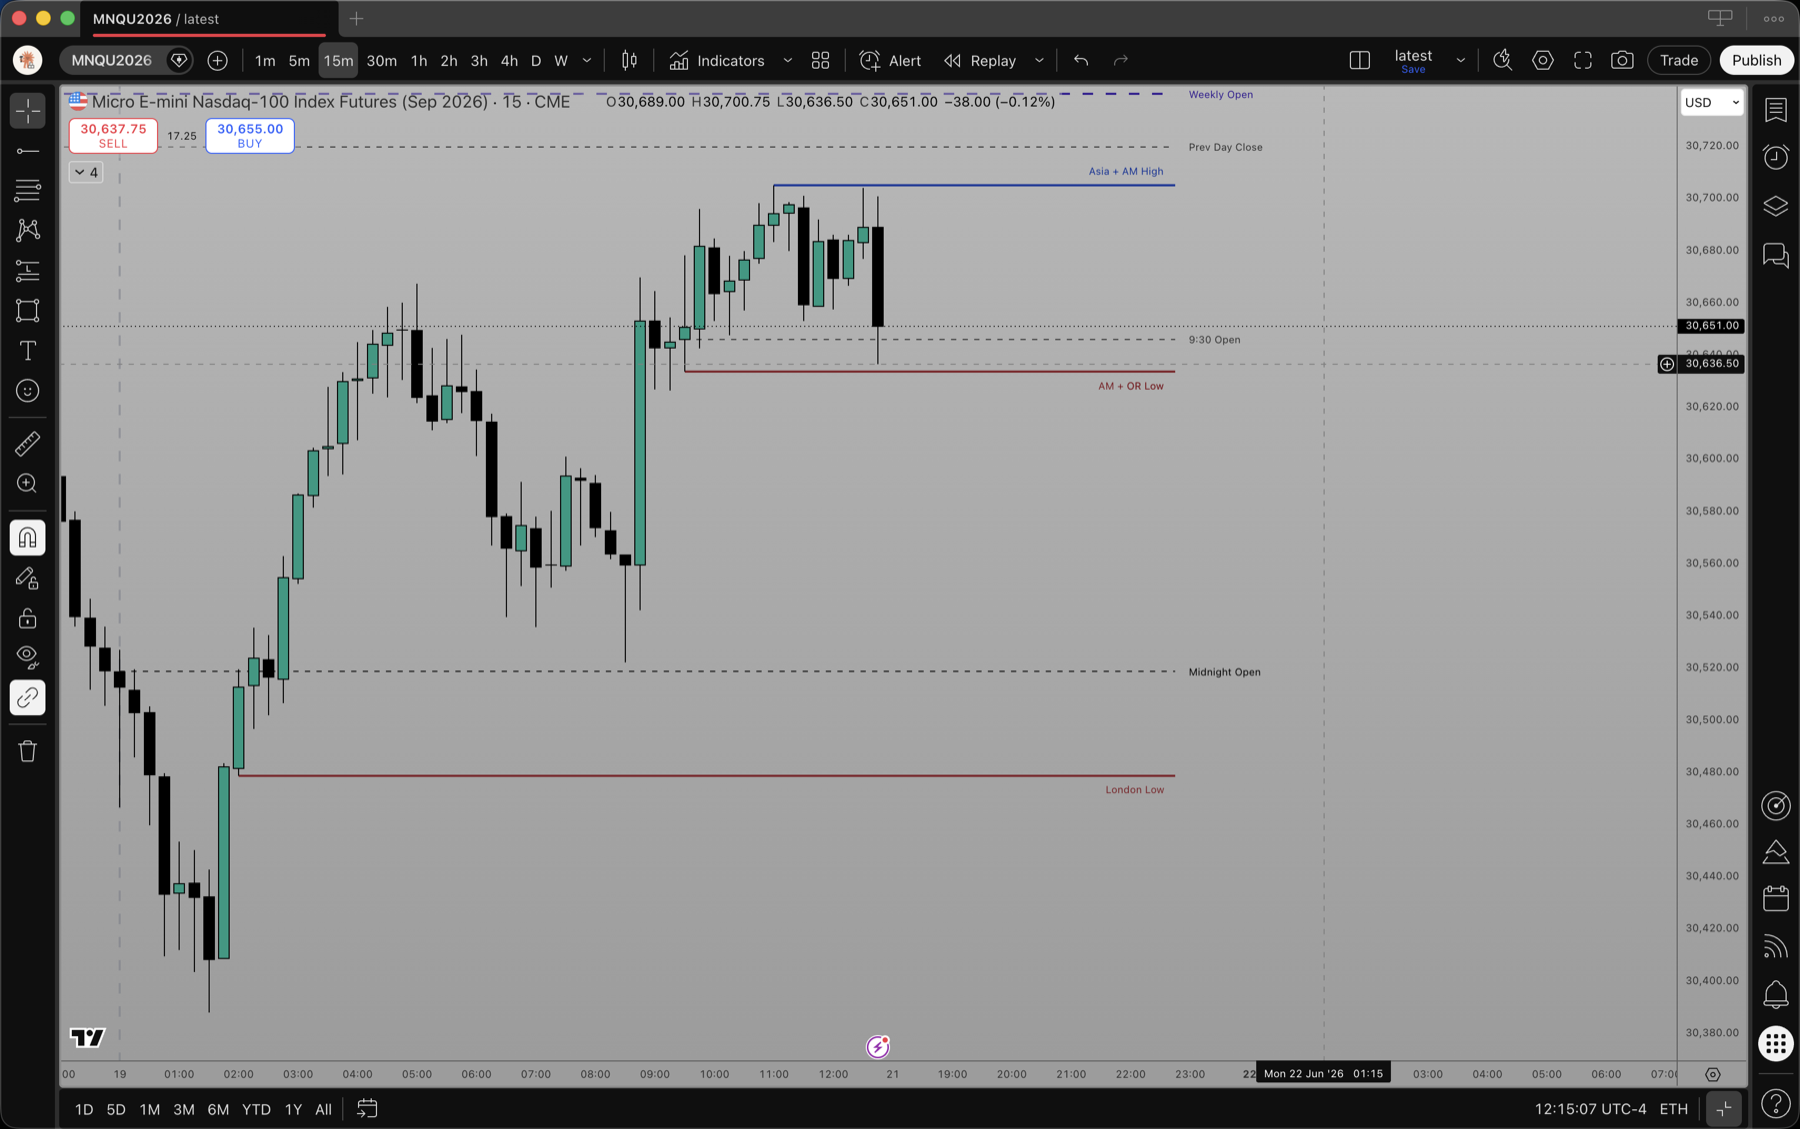
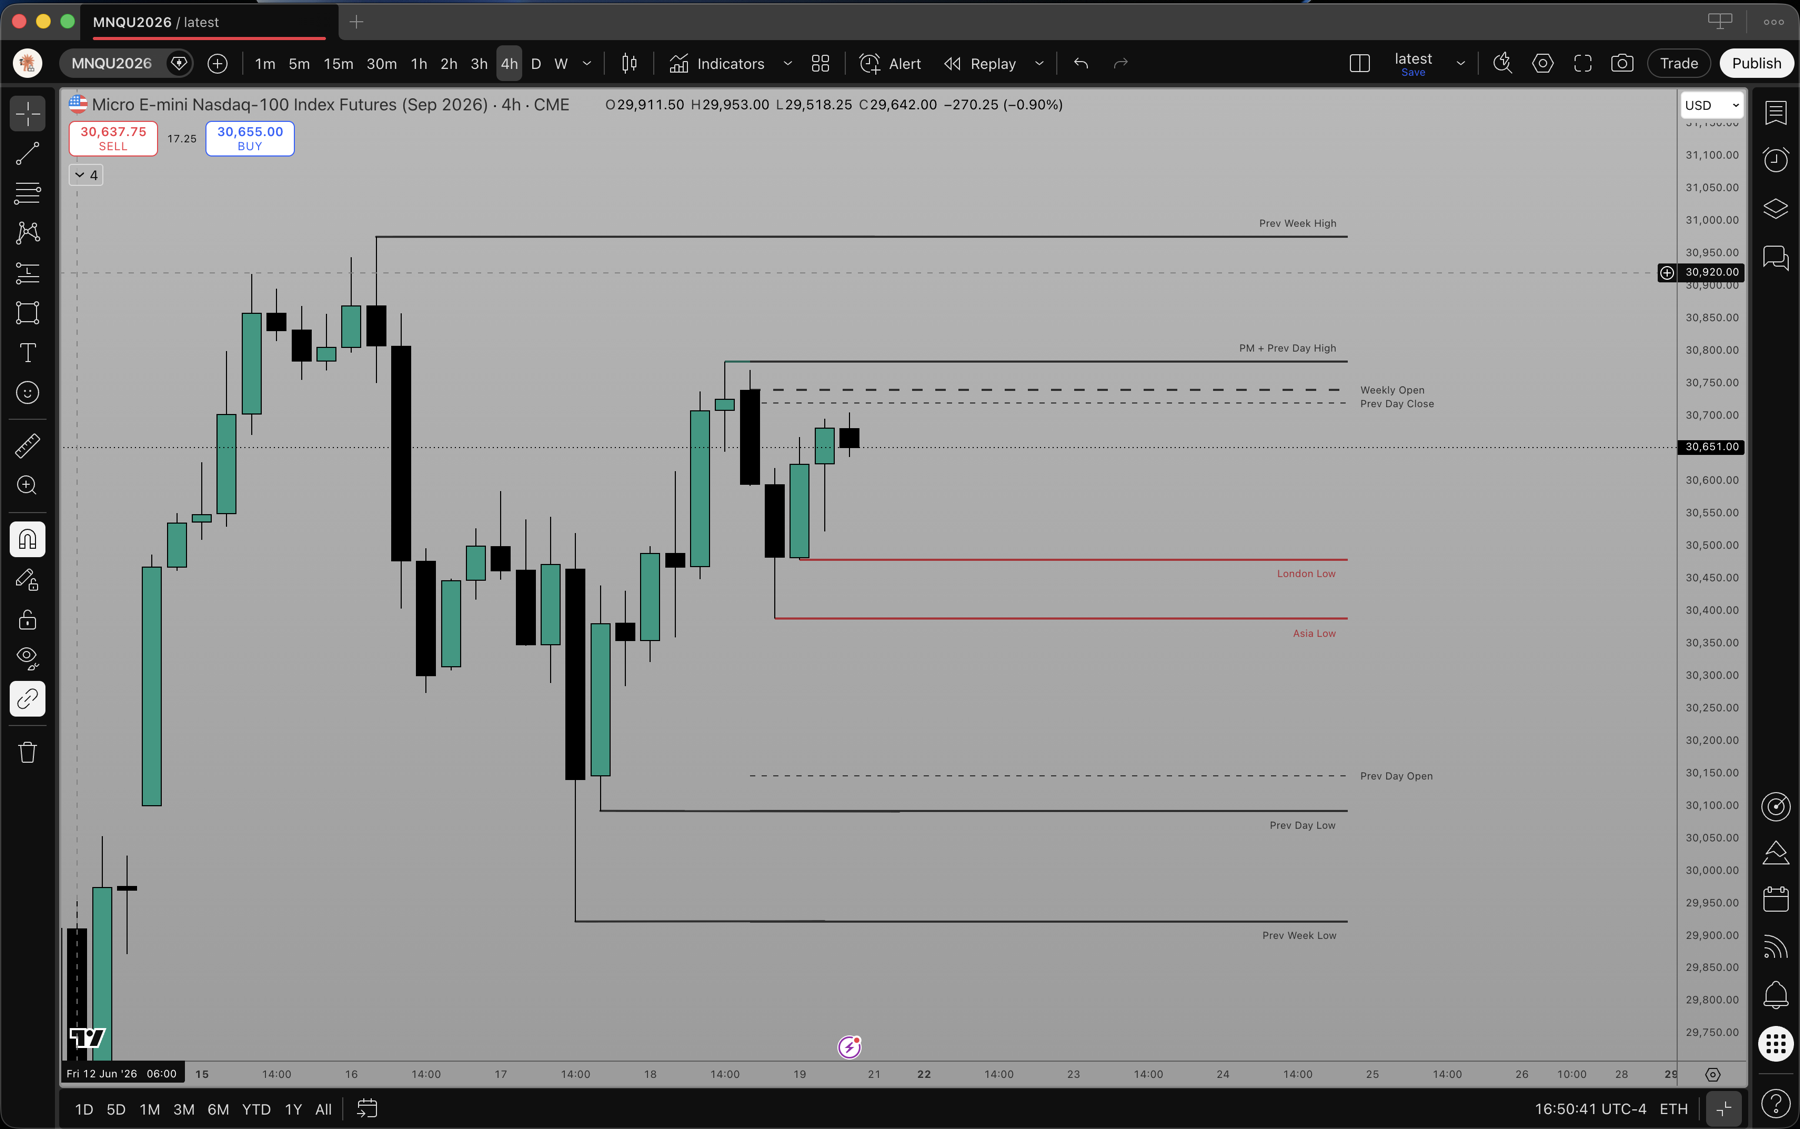
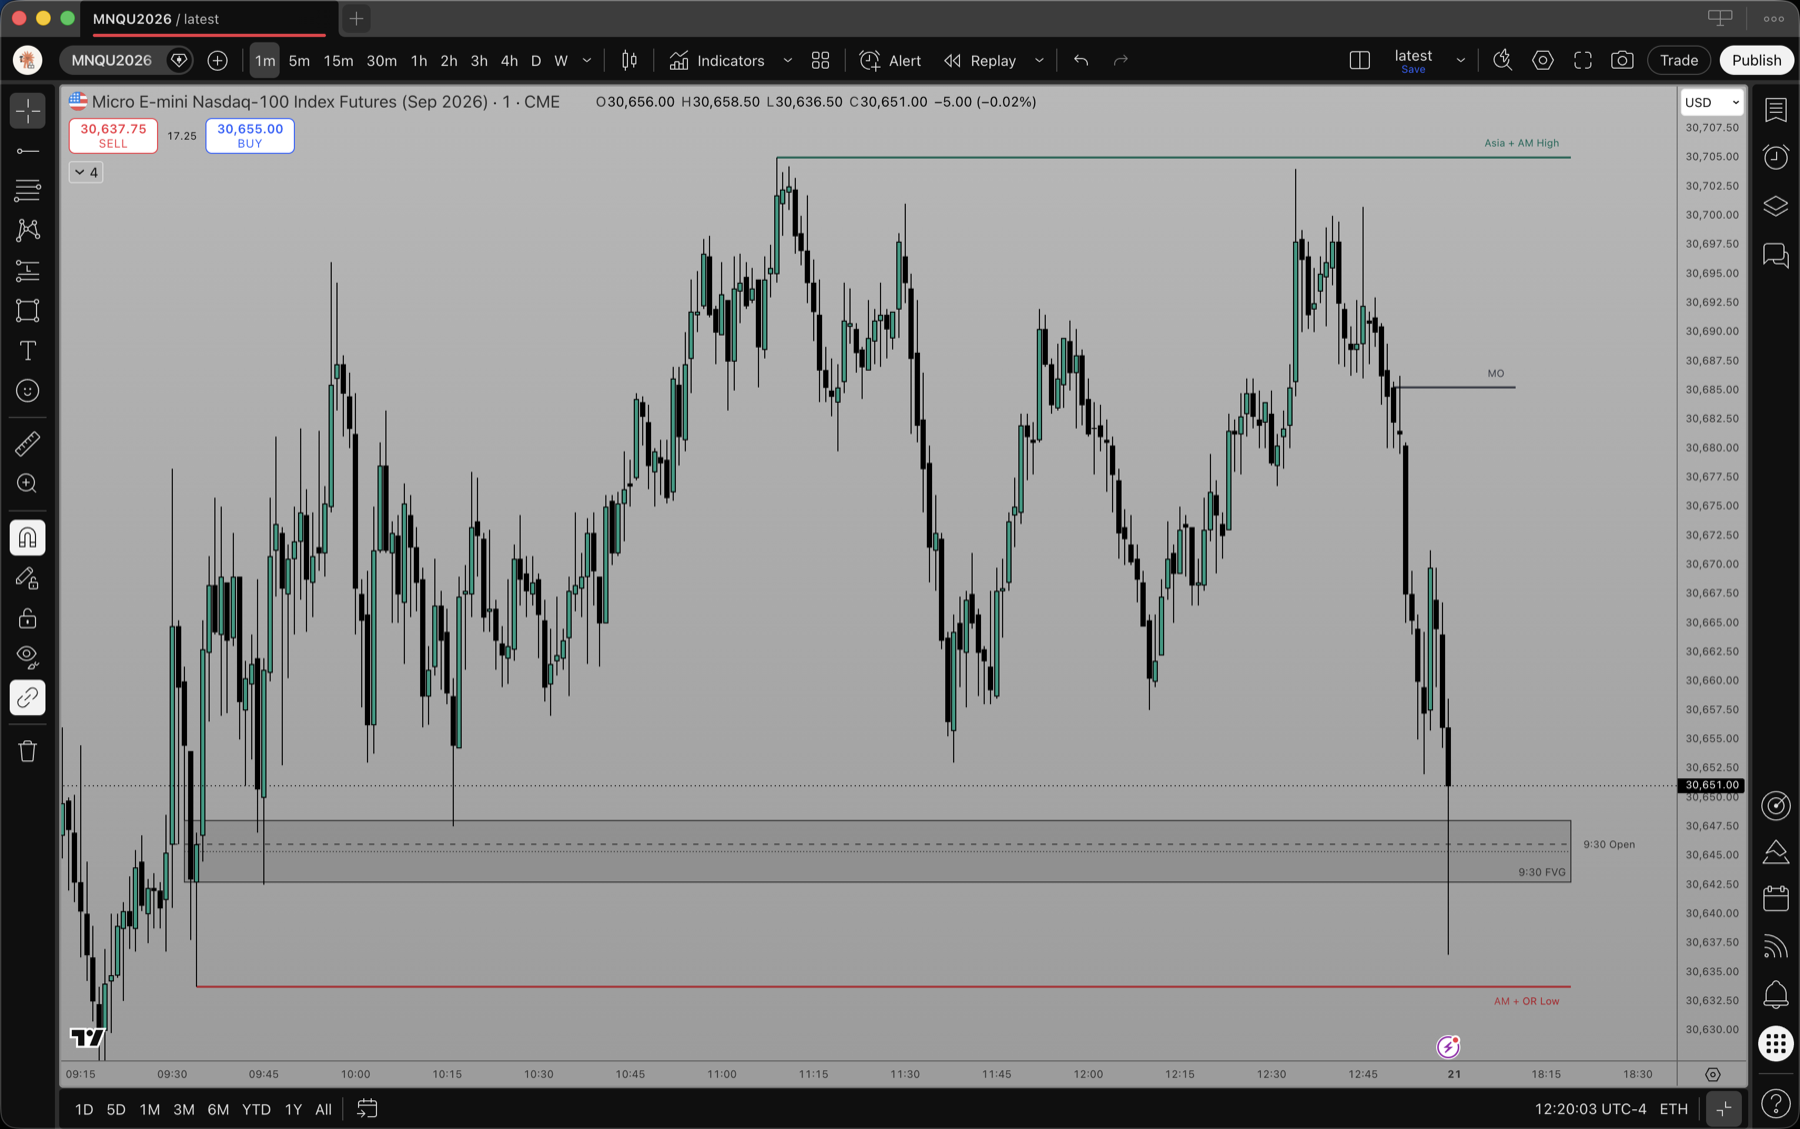
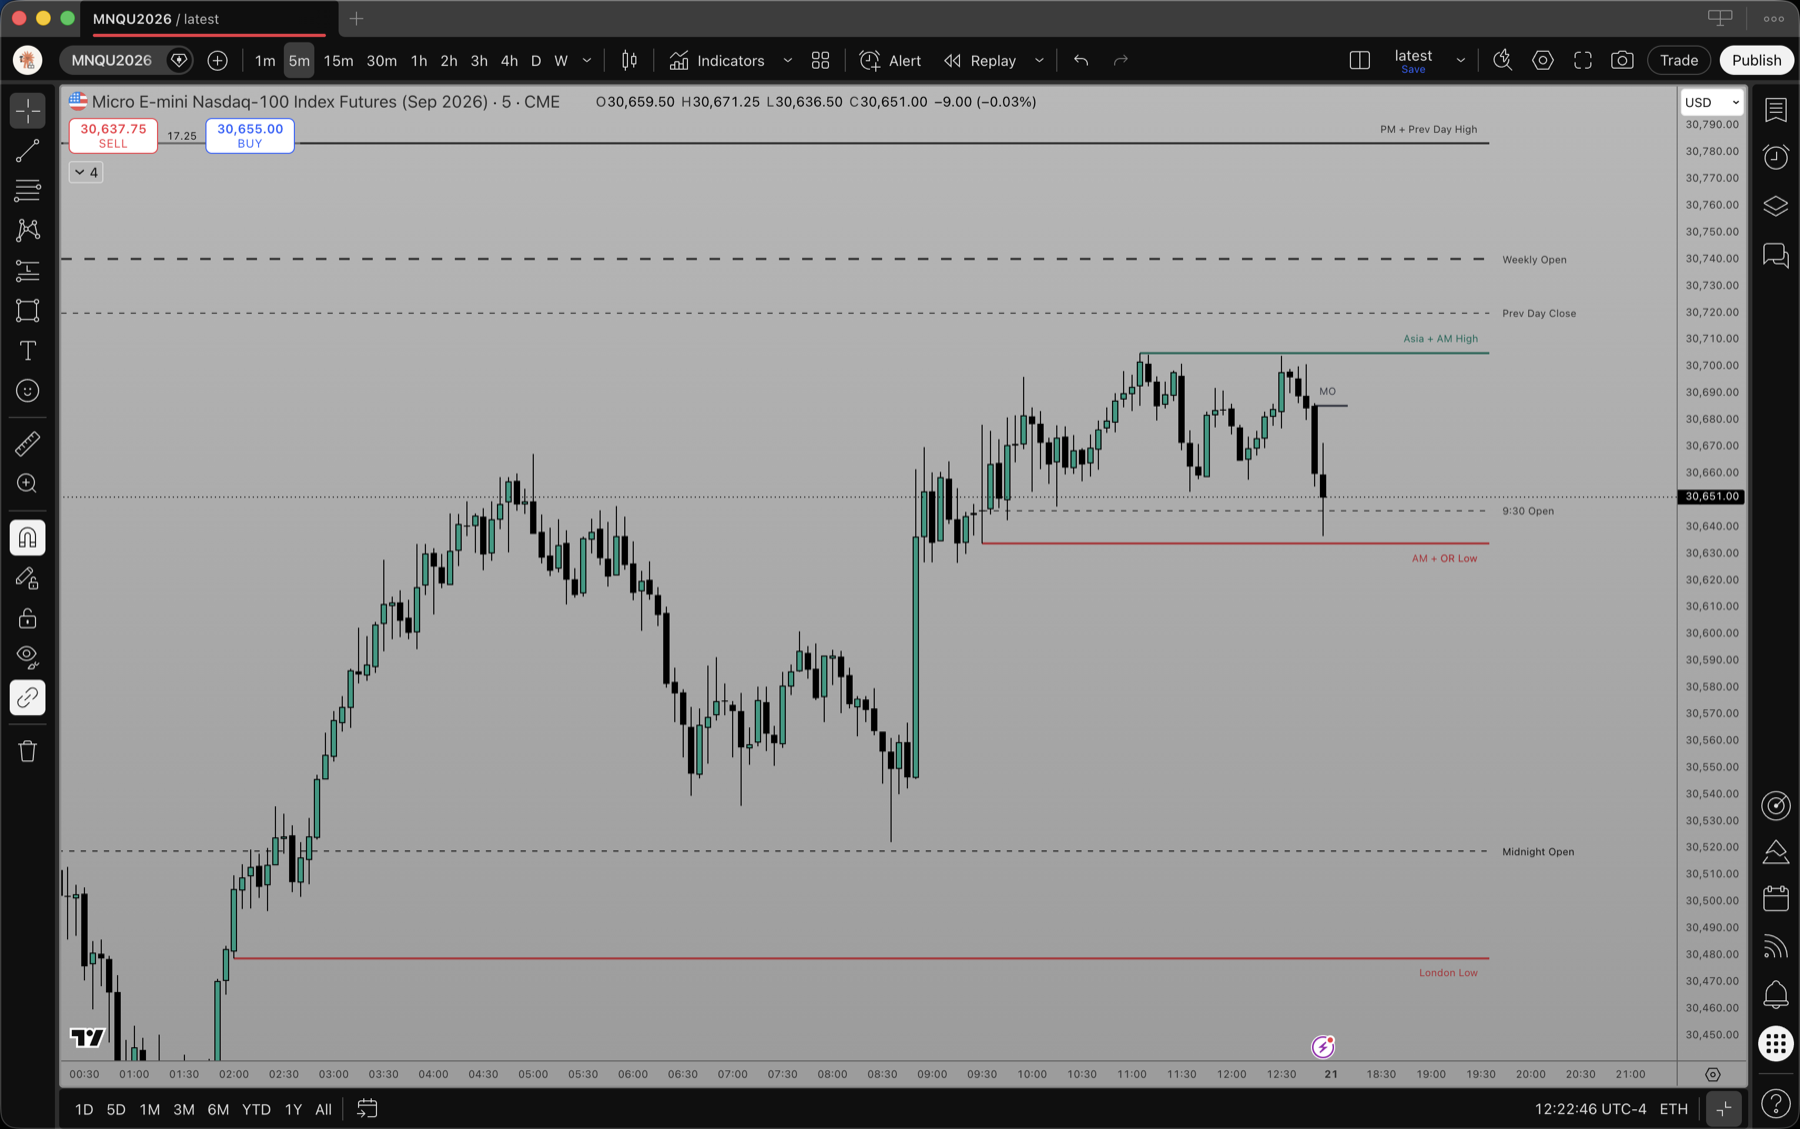
Session liquidity — Asia, London and the US sessions shaded live.
Five of Flow Map's moves, caught live on the chart — sessions, the levels that matter, the first FVG, the macro windows, and tuning it to your setup.
The levels ICT traders actually watch — sessions, killzones and macro windows — plotted live so you read price, not a wall of tabs.
London, New York and Asia sessions shaded on the chart, with previous-day and previous-week highs, lows and key opens — the liquidity in play, always in view.
The recurring macro windows flagged automatically as they approach — no alarms on your phone, just a clear marker where it matters.
Everything updates with price inside TradingView. No second screen, no spreadsheet, no 14 tabs — just the levels you care about.
Flow Map is a TradingView indicator I built with Claude's help and run daily. Buy once and it's added to your own TradingView charts, with a short guide to set it up and trade with it. No subscription, no API key — TradingView hosts it, and it updates automatically whenever I ship an improvement.
Your purchase comes with the private link to Flow Map. Open it, add the indicator to your chart, and it's yours to use.
A short guide walks you through running it on your intraday charts, choosing the sessions you trade, and switching on sweep and approach alerts.
It runs inside TradingView — hosted by them, no server to keep alive, no API key to wire up. New versions roll out to your chart automatically.
Get the indicator and the setup guide for £15 — one purchase, added to your own TradingView charts, yours to keep.